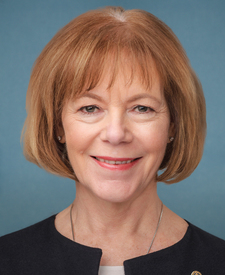
Tina Smith stock trades
Democrat · Senator from Minnesota
In Congress since 2018
Tina Smith has disclosed 43 trades since 2018, most recently on May 10, 2026. Smith's most-traded stocks are PODD, TCMD and CGNT. 3 trades were in an industry overseen by a committee Smith sits on. 1 was reported after the 45-day deadline. Over the past year, a portfolio of Smith's disclosed stock trades returned an estimated −30.7%, against +10.9% for the S&P 500.
- Trades disclosed
- 43
- Buys / sells
- 8 / 34
- Reported value
- $3.9M–$8.9M
- Committee overlaps
- 3
- Stocks traded
- 18
- Late filings
- 1
- First trade
- Jan 5, 2018
- Last disclosed
- May 10, 2026
Estimated returns
How a portfolio built from Smith's disclosed stock trades would have performed, next to the S&P 500.
Show as a table
| Date | Smith (est.) | S&P 500 |
|---|---|---|
| Nov 6, 2025 | +0.0% | +0.0% |
| Nov 13, 2025 | −1.6% | +0.3% |
| Nov 20, 2025 | −4.2% | −2.7% |
| Nov 28, 2025 | +2.0% | +2.0% |
| Dec 5, 2025 | +3.2% | +2.3% |
| Dec 12, 2025 | +3.7% | +1.7% |
| Dec 19, 2025 | +7.3% | +1.8% |
| Dec 29, 2025 | +7.6% | +2.9% |
| Jan 6, 2026 | +8.5% | +3.5% |
| Jan 13, 2026 | +4.5% | +3.8% |
| Jan 21, 2026 | +7.2% | +2.6% |
| Jan 28, 2026 | +0.2% | +4.1% |
| Feb 4, 2026 | −3.0% | +2.7% |
| Feb 11, 2026 | −3.0% | +3.5% |
| Feb 19, 2026 | −4.6% | +2.4% |
| Feb 26, 2026 | −1.6% | +3.1% |
| Mar 5, 2026 | −2.8% | +1.9% |
| Mar 12, 2026 | −8.0% | −0.3% |
| Mar 19, 2026 | −8.4% | −1.3% |
| Mar 26, 2026 | −9.1% | −3.2% |
| Apr 2, 2026 | −15.5% | −1.6% |
| Apr 10, 2026 | −13.2% | +1.9% |
| Apr 17, 2026 | −9.2% | +6.5% |
| Apr 24, 2026 | −10.2% | +7.1% |
| May 1, 2026 | −15.8% | +8.1% |
| May 8, 2026 | −24.8% | +10.7% |
| May 15, 2026 | −33.0% | +10.9% |
| May 22, 2026 | −29.7% | +11.9% |
| Jun 1, 2026 | −33.1% | +13.8% |
| Jun 8, 2026 | −31.8% | +10.9% |
| Jun 15, 2026 | −29.0% | +13.3% |
| Jun 23, 2026 | −29.4% | +10.3% |
| Jun 30, 2026 | −21.5% | +12.3% |
| Jul 8, 2026 | −19.8% | +12.1% |
| Jul 15, 2026 | −21.2% | +13.5% |
| Jul 22, 2026 | −21.8% | +12.4% |
| Jul 29, 2026 | −19.1% | +9.7% |
| Aug 5, 2026 | −16.5% | +15.8% |
| Aug 12, 2026 | −22.6% | +16.2% |
| Aug 19, 2026 | −23.9% | +15.7% |
| Aug 26, 2026 | −26.1% | +15.2% |
| Sep 2, 2026 | −29.1% | +15.1% |
| Sep 10, 2026 | −31.3% | +14.0% |
| Sep 17, 2026 | −31.9% | +14.7% |
| Sep 24, 2026 | −32.4% | +15.7% |
| Oct 1, 2026 | −35.8% | +15.2% |
| Oct 8, 2026 | −36.0% | +16.7% |
| Oct 15, 2026 | −33.2% | +16.4% |
| Oct 22, 2026 | −30.1% | +15.2% |
| Oct 29, 2026 | −29.5% | +16.0% |
| Nov 5, 2026 | −23.7% | +10.5% |
| Nov 6, 2026 | −30.7% | +10.9% |
Each disclosed stock purchase buys the midpoint of its reported range at that day's close, and sales sell it; returns are time-weighted and include dividends. Members report ranges rather than exact amounts and can file up to 45 days after a trade, so this is an estimate, not Smith's actual return. Based on 2 holdings as of Nov 6, 2026.
Committees
Trades in industries these committees oversee are flagged as committee overlaps.
- Agriculture
- Banking
- Finance
- Indian Affairs
Committee overlaps
Trades in an industry overseen by a committee Smith sits on. An overlap is a fact about the trade, not evidence of wrongdoing.
Most-traded stocks
All trades
- May 10, 2026$100K–$250K
$100K–$250K · Traded May 7, 2026 · disclosed May 10, 2026 · Spouse
- May 10, 2026$100K–$250K
$100K–$250K · Traded May 7, 2026 · disclosed May 10, 2026 · Spouse
- May 10, 2026$100K–$250K
$100K–$250K · Traded Apr 29, 2026 · disclosed May 10, 2026 · Spouse
- May 10, 2026$100K–$250K
$100K–$250K · Traded Apr 29, 2026 · disclosed May 10, 2026 · Spouse
- Apr 2, 2026$50K–$100K
$50K–$100K · Traded Mar 31, 2026 · disclosed Apr 2, 2026 · Spouse
- Apr 2, 2026$100K–$250K
Sold (full) Berkshire Hathaway BRK-B
$100K–$250K · Traded Mar 31, 2026 · disclosed Apr 2, 2026 · Spouse
Committee overlap: Banking - Jan 30, 2026$50K–$100K
Sold (full) MRSH - Marsh & McLennan Companies, Inc. Common Stock
$50K–$100K · Traded Jan 27, 2026 · disclosed Jan 30, 2026 · Spouse
- Jan 30, 2026$100K–$250K
Sold (partial) Berkshire Hathaway BRK-B
$100K–$250K · Traded Jan 27, 2026 · disclosed Jan 30, 2026 · Spouse
Committee overlap: Banking - Nov 26, 2025$100K–$250K
Sold (full) Huntington Bancshares HBAN
$100K–$250K · Traded Nov 21, 2025 · disclosed Nov 26, 2025 · Spouse
Committee overlap: Banking - Mar 19, 2025$100K–$250K
$100K–$250K · Traded Feb 11, 2025 · disclosed Mar 19, 2025 · Spouse
- Mar 19, 2025$100K–$250K
$100K–$250K · Traded Feb 11, 2025 · disclosed Mar 19, 2025 · Spouse
- Nov 21, 2024$50K–$100K
Bought Tactile Systems Technology TCMD
$50K–$100K · Traded Nov 12, 2024 · disclosed Nov 21, 2024 · Spouse
- Apr 19, 2024$50K–$100K
$50K–$100K · Traded Apr 4, 2024 · disclosed Apr 19, 2024 · Spouse
- Apr 19, 2024$100K–$250K
Sold (partial) NextEra Energy NEE
$100K–$250K · Traded Apr 4, 2024 · disclosed Apr 19, 2024 · Spouse
Got $15K from the company’s PAC - Nov 20, 2023$50K–$100K
$50K–$100K · Traded Nov 16, 2023 · disclosed Nov 20, 2023 · Spouse
- Nov 20, 2023$50K–$100K
$50K–$100K · Traded Nov 10, 2023 · disclosed Nov 20, 2023 · Spouse
- Nov 20, 2023$100K–$250K
Bought Tactile Systems Technology TCMD
$100K–$250K · Traded Nov 8, 2023 · disclosed Nov 20, 2023 · Spouse
- Apr 19, 2023$50K–$100K
Sold (full) Cardiovascular Systems CSII
$50K–$100K · Traded Apr 5, 2023 · disclosed Apr 19, 2023 · Spouse
- Apr 19, 2023$50K–$100K
Sold (full) Cardiovascular Systems CSII
$50K–$100K · Traded Apr 5, 2023 · disclosed Apr 19, 2023 · Spouse
- Apr 19, 2023$100K–$250K
$100K–$250K · Traded Apr 5, 2023 · disclosed Apr 19, 2023 · Spouse
- Oct 17, 2022$50K–$100K
$50K–$100K · Traded Sep 23, 2022 · disclosed Oct 17, 2022 · Spouse
- May 16, 2022$100K–$250K
$100K–$250K · Traded Jun 9, 2021 · disclosed May 16, 2022 · Spouse · filed 341 days later
- Apr 20, 2022$15K–$50K
$15K–$50K · Traded Apr 4, 2022 · disclosed Apr 20, 2022 · Spouse
- Apr 16, 2020$250K–$500K
$250K–$500K · Traded Mar 17, 2020 · disclosed Apr 16, 2020 · Spouse
- Apr 16, 2020$250K–$500K
$250K–$500K · Traded Mar 17, 2020 · disclosed Apr 16, 2020 · Spouse
- Apr 24, 2019$250K–$500K
Sold (full) Abbott Laboratories ABT
$250K–$500K · Traded Apr 9, 2019 · disclosed Apr 24, 2019 · Joint
Got $10K from the company’s PAC - Nov 14, 2018$50K–$100K
Bought Mainstay Medical International plc MSTY.PA
$50K–$100K · Traded Oct 30, 2018 · disclosed Nov 14, 2018 · Spouse
- Nov 14, 2018$50K–$100K
Bought Mainstay Medical International plc MSTY.PA
$50K–$100K · Traded Oct 29, 2018 · disclosed Nov 14, 2018 · Spouse
- Sep 19, 2018$100K–$250K
$100K–$250K · Traded Aug 30, 2018 · disclosed Sep 19, 2018 · Spouse
- Sep 19, 2018$15K–$50K
$15K–$50K · Traded Aug 30, 2018 · disclosed Sep 19, 2018 · Spouse
- Sep 19, 2018$250K–$500K
$250K–$500K · Traded Aug 30, 2018 · disclosed Sep 19, 2018 · Joint
- Sep 19, 2018$1K–$15K
$1K–$15K · Traded Aug 30, 2018 · disclosed Sep 19, 2018 · Spouse
- Aug 21, 2018$100K–$250K
$100K–$250K · Traded Jul 26, 2018 · disclosed Aug 21, 2018 · Spouse
- Jun 11, 2018$100K–$250K
Sold (partial) Tactile Systems Technology TCMD
$100K–$250K · Traded Jun 1, 2018 · disclosed Jun 11, 2018 · Spouse
- Jun 11, 2018$100K–$250K
Sold (full) Tactile Systems Technology TCMD
$100K–$250K · Traded Jun 1, 2018 · disclosed Jun 11, 2018 · Spouse
- Jun 11, 2018$100K–$250K
$100K–$250K · Traded Jun 1, 2018 · disclosed Jun 11, 2018 · Spouse
- Apr 20, 2018$100K–$250K
Sold (full) Cognyte Software CGNT
$100K–$250K · Traded Apr 12, 2018 · disclosed Apr 20, 2018 · Spouse
- Apr 20, 2018$15K–$50K
Sold (partial) Cognyte Software CGNT
$15K–$50K · Traded Apr 12, 2018 · disclosed Apr 20, 2018 · Spouse
- Apr 20, 2018$15K–$50K
Sold (partial) Cognyte Software CGNT
$15K–$50K · Traded Apr 10, 2018 · disclosed Apr 20, 2018 · Spouse
- Apr 9, 2018$1K–$15K
Sold (partial) Cognyte Software CGNT
$1K–$15K · Traded Mar 29, 2018 · disclosed Apr 9, 2018 · Spouse
- Mar 6, 2018$100K–$250K
$100K–$250K · Traded Mar 2, 2018 · disclosed Mar 6, 2018 · Joint
- Jan 29, 2018$250K–$500K
$250K–$500K · Traded Jan 16, 2018 · disclosed Jan 29, 2018 · Spouse
- Jan 29, 2018$50K–$100K
Sold (full) Leverage Shares 2x Long ENTG Daily ETF ENTL
$50K–$100K · Traded Jan 5, 2018 · disclosed Jan 29, 2018 · Joint
From periodic transaction reports Smith filed under the STOCK Act. Amounts are the ranges members report, and trades can be disclosed up to 45 days after they happen. Nothing here is investment advice.