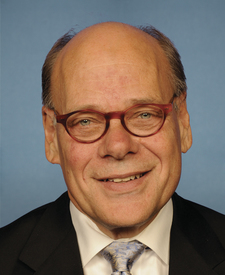
Steve Cohen stock trades
Democrat · Representative for Tennessee's 9th District
In Congress since 2007
Steve Cohen has disclosed 35 trades since 2023, most recently on Sep 1, 2026. Cohen's most-traded stocks are GS, SFGYY and FLR. 1 trade was in an industry overseen by a committee Cohen sits on. Over the past year, a portfolio of Cohen's disclosed stock trades returned an estimated +23.9%, against +10.9% for the S&P 500.
- Trades disclosed
- 35
- Buys / sells
- 21 / 14
- Reported value
- $4.9M–$13.4M
- Committee overlaps
- 1
- Stocks traded
- 14
- Late filings
- 0
- First trade
- Jan 31, 2023
- Last disclosed
- Sep 1, 2026
Estimated returns
How a portfolio built from Cohen's disclosed stock trades would have performed, next to the S&P 500.
Show as a table
| Date | Cohen (est.) | S&P 500 |
|---|---|---|
| Nov 6, 2025 | +0.0% | +0.0% |
| Nov 13, 2025 | +1.3% | +0.3% |
| Nov 20, 2025 | +0.4% | −2.7% |
| Nov 28, 2025 | +5.2% | +2.0% |
| Dec 5, 2025 | +6.4% | +2.3% |
| Dec 12, 2025 | +10.7% | +1.7% |
| Dec 19, 2025 | +14.1% | +1.8% |
| Dec 29, 2025 | +13.5% | +2.9% |
| Jan 6, 2026 | +17.4% | +3.5% |
| Jan 13, 2026 | +15.8% | +3.8% |
| Jan 21, 2026 | +18.1% | +2.6% |
| Jan 28, 2026 | +16.8% | +4.1% |
| Feb 4, 2026 | +27.9% | +2.7% |
| Feb 11, 2026 | +26.0% | +3.5% |
| Feb 19, 2026 | +28.2% | +2.4% |
| Feb 26, 2026 | +28.5% | +3.1% |
| Mar 5, 2026 | +21.9% | +1.9% |
| Mar 12, 2026 | +15.6% | −0.3% |
| Mar 19, 2026 | +15.1% | −1.3% |
| Mar 26, 2026 | +16.8% | −3.2% |
| Apr 2, 2026 | +20.4% | −1.6% |
| Apr 10, 2026 | +24.8% | +1.9% |
| Apr 17, 2026 | +27.9% | +6.5% |
| Apr 24, 2026 | +27.1% | +7.1% |
| May 1, 2026 | +30.0% | +8.1% |
| May 8, 2026 | +27.2% | +10.7% |
| May 15, 2026 | +23.5% | +10.9% |
| May 22, 2026 | +28.0% | +11.9% |
| Jun 1, 2026 | +29.5% | +13.8% |
| Jun 8, 2026 | +30.2% | +10.9% |
| Jun 15, 2026 | +33.6% | +13.3% |
| Jun 23, 2026 | +30.8% | +10.3% |
| Jun 30, 2026 | +32.3% | +12.3% |
| Jul 8, 2026 | +30.5% | +12.1% |
| Jul 15, 2026 | +30.1% | +13.5% |
| Jul 22, 2026 | +33.8% | +12.4% |
| Jul 29, 2026 | +32.0% | +9.7% |
| Aug 5, 2026 | +33.6% | +15.8% |
| Aug 12, 2026 | +35.3% | +16.2% |
| Aug 19, 2026 | +32.3% | +15.7% |
| Aug 26, 2026 | +32.6% | +15.2% |
| Sep 2, 2026 | +29.4% | +15.1% |
| Sep 10, 2026 | +29.3% | +14.0% |
| Sep 17, 2026 | +26.7% | +14.7% |
| Sep 24, 2026 | +19.7% | +15.7% |
| Oct 1, 2026 | +20.5% | +15.2% |
| Oct 8, 2026 | +22.1% | +16.7% |
| Oct 15, 2026 | +21.3% | +16.4% |
| Oct 22, 2026 | +24.8% | +15.2% |
| Oct 29, 2026 | +25.9% | +16.0% |
| Nov 5, 2026 | +25.6% | +10.5% |
| Nov 6, 2026 | +23.9% | +10.9% |
Each disclosed stock purchase buys the midpoint of its reported range at that day's close, and sales sell it; returns are time-weighted and include dividends. Members report ranges rather than exact amounts and can file up to 45 days after a trade, so this is an estimate, not Cohen's actual return. Based on 2 holdings as of Nov 6, 2026.
Committees
Trades in industries these committees oversee are flagged as committee overlaps.
- Judiciary
- Intelligence
Committee overlaps
Trades in an industry overseen by a committee Cohen sits on. An overlap is a fact about the trade, not evidence of wrongdoing.
Most-traded stocks
All trades
- Sep 1, 2026$250K–$500K
Bought US Treas Bills Int Rate 0.000% MAT 8/5/2027
$250K–$500K · Traded Aug 21, 2026 · disclosed Sep 1, 2026
- Sep 1, 2026$250K–$500K
Bought US Treas Bills Int Rate 0.000% MAT 2/18/2027
$250K–$500K · Traded Aug 21, 2026 · disclosed Sep 1, 2026
- Aug 17, 2026$100K–$250K
Bought U.S. Tres Bill Int. Rate 0.00% Mat 8/5/2027
$100K–$250K · Traded Aug 6, 2026 · disclosed Aug 17, 2026
- Aug 17, 2026$100K–$250K
Bought JPMorgan Chase BK N A INSTL CTF DEP ACT/365 4.200% MAT 8/11/2027
$100K–$250K · Traded Aug 5, 2026 · disclosed Aug 17, 2026
- Jun 17, 2026$500K–$1M
Bought US Treas Bills MAT 11/19/26
$500K–$1M · Traded May 27, 2026 · disclosed Jun 17, 2026
- May 20, 2026$50K–$100K
Bought US Treas Bill Mat 10/29/2026 DTD 10/30/2025
$50K–$100K · Traded May 4, 2026 · disclosed May 20, 2026
- Apr 28, 2026$1K–$15K
Sold METROPOLITAN GOVT NA DAVIDSON CNTY TENN HEALTH & ED L FACS BRD 3.750% 03/15/28 B
$1K–$15K · Traded Mar 16, 2026 · disclosed Apr 28, 2026
- Mar 26, 2026$500K–$1M
Bought US Treasury Bills, due 8/20/2026
$500K–$1M · Traded Feb 23, 2026 · disclosed Mar 26, 2026
- Mar 5, 2026$250K–$500K
Bought United States Treasury Bill Mat 5/21/26
$250K–$500K · Traded Feb 20, 2026 · disclosed Mar 5, 2026
- Feb 9, 2026$1K–$15K
Bought SONY FINL GROUP INC U/ADR SFGYY
$1K–$15K · Traded Dec 26, 2025 · disclosed Feb 9, 2026
- Jan 26, 2026$15K–$50K
Sold (partial) Northrop Grumman NOC
$15K–$50K · Traded Dec 29, 2025 · disclosed Jan 26, 2026
Committee overlap: Intelligence - Jan 26, 2026$15K–$50K
$15K–$50K · Traded Dec 29, 2025 · disclosed Jan 26, 2026
- Jan 14, 2026$15K–$50K
Sold (partial) The Goldman Sachs Group GS
$15K–$50K · Traded Dec 17, 2025 · disclosed Jan 14, 2026
- Jan 14, 2026$15K–$50K
Sold (partial) The Goldman Sachs Group GS
$15K–$50K · Traded Dec 17, 2025 · disclosed Jan 14, 2026
- Jan 14, 2026$50K–$100K
Sold (partial) Morgan Stanley MS
$50K–$100K · Traded Dec 17, 2025 · disclosed Jan 14, 2026
- Jan 14, 2026$15K–$50K
$15K–$50K · Traded Dec 17, 2025 · disclosed Jan 14, 2026
- Jan 14, 2026$1K–$15K
Sold Cohen & Steers Total Return Realty Fund RFI
$1K–$15K · Traded Dec 17, 2025 · disclosed Jan 14, 2026
- Dec 16, 2025$250K–$500K
Bought US Treas Bill Mat 5/14/2026
$250K–$500K · Traded Nov 18, 2025 · disclosed Dec 16, 2025
- Sep 12, 2025$1M–$5M
Bought US Treas Bill Maturity 2/19/2026
$1M–$5M · Traded Aug 21, 2025 · disclosed Sep 12, 2025
- May 28, 2025$250K–$500K
Bought United States Treas Bills Maturity 11/13/2025
$250K–$500K · Traded May 19, 2025 · disclosed May 28, 2025
- Apr 1, 2025$500K–$1M
Bought United States Treas Bills Maturity 8/21/2025
$500K–$1M · Traded Feb 24, 2025 · disclosed Apr 1, 2025
- Jan 10, 2025$15K–$50K
Sold Host Hotels & Resorts HST
$15K–$50K · Traded Dec 11, 2024 · disclosed Jan 10, 2025
- Jan 10, 2025$1K–$15K
Sold Emergent BioSolutions EBS
$1K–$15K · Traded Dec 11, 2024 · disclosed Jan 10, 2025
- Feb 28, 2024$15K–$50K
Bought Eastside Utility District (Hamilton County, TN)
$15K–$50K · Traded Feb 3, 2024 · disclosed Feb 28, 2024
- Feb 28, 2024$15K–$50K
Bought Bradley County Tennessee Govt Bonds
$15K–$50K · Traded Feb 3, 2024 · disclosed Feb 28, 2024
- Jan 4, 2024$1K–$15K
$1K–$15K · Traded Dec 11, 2023 · disclosed Jan 4, 2024
- Jan 4, 2024$1K–$15K
Sold Daimler Truck Holding AG DTRUY
$1K–$15K · Traded Dec 11, 2023 · disclosed Jan 4, 2024
- Jul 28, 2023$15K–$50K
$15K–$50K · Traded Jun 29, 2023 · disclosed Jul 28, 2023
Got $35K from the company’s PAC - Jun 26, 2023$15K–$50K
$15K–$50K · Traded May 26, 2023 · disclosed Jun 26, 2023
- Feb 13, 2023$15K–$50K
Bought FT UNIT 10479 PFD INCOME PORTFOLIO SER 114
$15K–$50K · Traded Feb 6, 2023 · disclosed Feb 13, 2023
- Feb 4, 2023$15K–$50K
Sold Western Asset Inflation-Linked Opportunities & Income Fund WIW
$15K–$50K · Traded Jan 31, 2023 · disclosed Feb 4, 2023
- Feb 4, 2023$100K–$250K
Sold PUTNAM ULTRA SHORT DURATION INCOME FUND CLASS A
$100K–$250K · Traded Jan 31, 2023 · disclosed Feb 4, 2023
- Feb 4, 2023$250K–$500K
Bought FIRST NATL BK & TR WEATHERFORD TEX CTF DEP ACT
$250K–$500K · Traded Jan 31, 2023 · disclosed Feb 4, 2023
- Feb 4, 2023$100K–$250K
Bought FEDERATED HERMES GOVERNMENT OBLIGATIONS FUND CLASS SS
$100K–$250K · Traded Jan 31, 2023 · disclosed Feb 4, 2023
- Feb 4, 2023$250K–$500K
Bought CHARLES SCHWAB BK SSB WESTLAKE TEX CTF DEP ACT
$250K–$500K · Traded Jan 31, 2023 · disclosed Feb 4, 2023
From periodic transaction reports Cohen filed under the STOCK Act. Amounts are the ranges members report, and trades can be disclosed up to 45 days after they happen. Nothing here is investment advice.