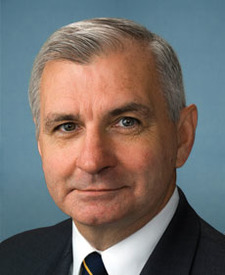
Jack Reed stock trades
Democrat · Senator from Rhode Island
In Congress since 1991 (House and Senate)
Jack Reed has disclosed 227 trades since 2014, most recently on Mar 18, 2019. Reed's most-traded stocks are CELG, TMO and DHR. 1 was reported after the 45-day deadline. Over the past year, a portfolio of Reed's disclosed stock trades returned an estimated +24.0%, against +10.9% for the S&P 500.
- Trades disclosed
- 227
- Buys / sells
- 97 / 129
- Reported value
- $283K–$3.5M
- Committee overlaps
- 0
- Stocks traded
- 59
- Late filings
- 1
- First trade
- Feb 21, 2014
- Last disclosed
- Mar 18, 2019
Estimated returns
How a portfolio built from Reed's disclosed stock trades would have performed, next to the S&P 500.
Show as a table
| Date | Reed (est.) | S&P 500 |
|---|---|---|
| Nov 6, 2025 | +0.0% | +0.0% |
| Nov 13, 2025 | −3.8% | +0.3% |
| Nov 20, 2025 | −9.5% | −2.7% |
| Nov 28, 2025 | −0.4% | +2.0% |
| Dec 5, 2025 | +4.6% | +2.3% |
| Dec 12, 2025 | +2.0% | +1.7% |
| Dec 19, 2025 | +1.5% | +1.8% |
| Dec 29, 2025 | +1.3% | +2.9% |
| Jan 6, 2026 | +7.3% | +3.5% |
| Jan 13, 2026 | +7.0% | +3.8% |
| Jan 21, 2026 | +9.8% | +2.6% |
| Jan 28, 2026 | +9.1% | +4.1% |
| Feb 4, 2026 | +7.6% | +2.7% |
| Feb 11, 2026 | +12.2% | +3.5% |
| Feb 19, 2026 | +9.4% | +2.4% |
| Feb 26, 2026 | +10.3% | +3.1% |
| Mar 5, 2026 | +4.2% | +1.9% |
| Mar 12, 2026 | +0.6% | −0.3% |
| Mar 19, 2026 | +2.0% | −1.3% |
| Mar 26, 2026 | +1.5% | −3.2% |
| Apr 2, 2026 | +4.1% | −1.6% |
| Apr 10, 2026 | +11.8% | +1.9% |
| Apr 17, 2026 | +22.8% | +6.5% |
| Apr 24, 2026 | +35.1% | +7.1% |
| May 1, 2026 | +38.6% | +8.1% |
| May 8, 2026 | +50.2% | +10.7% |
| May 15, 2026 | +48.6% | +10.9% |
| May 22, 2026 | +60.1% | +11.9% |
| Jun 1, 2026 | +60.8% | +13.8% |
| Jun 8, 2026 | +59.3% | +10.9% |
| Jun 15, 2026 | +67.8% | +13.3% |
| Jun 23, 2026 | +62.2% | +10.3% |
| Jun 30, 2026 | +68.1% | +12.3% |
| Jul 8, 2026 | +53.4% | +12.1% |
| Jul 15, 2026 | +50.8% | +13.5% |
| Jul 22, 2026 | +49.1% | +12.4% |
| Jul 29, 2026 | +31.9% | +9.7% |
| Aug 5, 2026 | +44.7% | +15.8% |
| Aug 12, 2026 | +51.5% | +16.2% |
| Aug 19, 2026 | +44.9% | +15.7% |
| Aug 26, 2026 | +42.5% | +15.2% |
| Sep 2, 2026 | +38.2% | +15.1% |
| Sep 10, 2026 | +39.7% | +14.0% |
| Sep 17, 2026 | +41.3% | +14.7% |
| Sep 24, 2026 | +46.0% | +15.7% |
| Oct 1, 2026 | +47.8% | +15.2% |
| Oct 8, 2026 | +46.1% | +16.7% |
| Oct 15, 2026 | +37.2% | +16.4% |
| Oct 22, 2026 | +31.6% | +15.2% |
| Oct 29, 2026 | +38.1% | +16.0% |
| Nov 5, 2026 | +19.4% | +10.5% |
| Nov 6, 2026 | +24.0% | +10.9% |
Each disclosed stock purchase buys the midpoint of its reported range at that day's close, and sales sell it; returns are time-weighted and include dividends. Members report ranges rather than exact amounts and can file up to 45 days after a trade, so this is an estimate, not Reed's actual return. Based on 4 holdings as of Nov 6, 2026.
Committees
Trades in industries these committees oversee are flagged as committee overlaps.
- Armed ServicesRanking Member
- IntelligenceEx Officio
- Appropriations
- Banking
Most-traded stocks
All trades
- Mar 18, 2019$1K–$15K
$1K–$15K · Traded Feb 28, 2019 · disclosed Mar 18, 2019
- Mar 18, 2019$1K–$15K
Sold (full) IQVIA Holdings IQV
$1K–$15K · Traded Feb 28, 2019 · disclosed Mar 18, 2019
- Mar 18, 2019$1K–$15K
Sold (full) Analog Devices ADI
$1K–$15K · Traded Feb 28, 2019 · disclosed Mar 18, 2019
- Mar 18, 2019$15K–$50K
$15K–$50K · Traded Feb 28, 2019 · disclosed Mar 18, 2019
- Mar 18, 2019$1K–$15K
$1K–$15K · Traded Feb 28, 2019 · disclosed Mar 18, 2019 · Joint
- Mar 18, 2019$15K–$50K
$15K–$50K · Traded Feb 28, 2019 · disclosed Mar 18, 2019
- Mar 18, 2019$1K–$15K
$1K–$15K · Traded Feb 28, 2019 · disclosed Mar 18, 2019
- Mar 18, 2019$1K–$15K
$1K–$15K · Traded Feb 28, 2019 · disclosed Mar 18, 2019
Got $25K from the company’s PAC - Mar 18, 2019$15K–$50K
$15K–$50K · Traded Feb 28, 2019 · disclosed Mar 18, 2019
- Mar 18, 2019$1K–$15K
Sold (full) Thermo Fisher Scientific TMO
$1K–$15K · Traded Feb 28, 2019 · disclosed Mar 18, 2019 · Joint
- Mar 18, 2019$1K–$15K
Sold (full) Intuitive Surgical ISRG
$1K–$15K · Traded Feb 28, 2019 · disclosed Mar 18, 2019
- Mar 18, 2019$1K–$15K
Sold (full) Costco Wholesale COST
$1K–$15K · Traded Feb 28, 2019 · disclosed Mar 18, 2019
- Mar 18, 2019$1K–$15K
Sold (full) Thermo Fisher Scientific TMO
$1K–$15K · Traded Feb 28, 2019 · disclosed Mar 18, 2019
- Mar 18, 2019$1K–$15K
$1K–$15K · Traded Feb 28, 2019 · disclosed Mar 18, 2019
- Mar 18, 2019$1K–$15K
$1K–$15K · Traded Feb 28, 2019 · disclosed Mar 18, 2019
- Mar 18, 2019$1K–$15K
$1K–$15K · Traded Feb 28, 2019 · disclosed Mar 18, 2019 · Joint
- Mar 18, 2019$1K–$15K
$1K–$15K · Traded Feb 28, 2019 · disclosed Mar 18, 2019 · Joint
- Mar 18, 2019$1K–$15K
$1K–$15K · Traded Feb 28, 2019 · disclosed Mar 18, 2019
- Mar 18, 2019$15K–$50K
$15K–$50K · Traded Feb 28, 2019 · disclosed Mar 18, 2019
- Mar 18, 2019$1K–$15K
$1K–$15K · Traded Feb 28, 2019 · disclosed Mar 18, 2019
- Mar 18, 2019$1K–$15K
$1K–$15K · Traded Feb 28, 2019 · disclosed Mar 18, 2019 · Joint
- Mar 18, 2019$1K–$15K
Sold (full) Analog Devices ADI
$1K–$15K · Traded Feb 28, 2019 · disclosed Mar 18, 2019 · Joint
- Mar 18, 2019$1K–$15K
Sold (full) Celgene Corporation CELG
$1K–$15K · Traded Feb 28, 2019 · disclosed Mar 18, 2019
- Mar 18, 2019$1K–$15K
Sold (full) IQVIA Holdings IQV
$1K–$15K · Traded Feb 28, 2019 · disclosed Mar 18, 2019 · Joint
- Mar 18, 2019$1K–$15K
$1K–$15K · Traded Feb 28, 2019 · disclosed Mar 18, 2019
- Mar 1, 2019$1K–$15K
Sold (full) Vertex Pharmaceuticals VRTX
$1K–$15K · Traded Feb 4, 2019 · disclosed Mar 1, 2019 · Joint
- Mar 1, 2019$1K–$15K
$1K–$15K · Traded Feb 4, 2019 · disclosed Mar 1, 2019 · Joint
- Mar 1, 2019$1K–$15K
$1K–$15K · Traded Feb 4, 2019 · disclosed Mar 1, 2019 · Joint
Got $10K from the company’s PAC - Mar 1, 2019$1K–$15K
Sold (full) Cisco Systems CSCO
$1K–$15K · Traded Feb 4, 2019 · disclosed Mar 1, 2019 · Joint
Got $1K from the company’s PAC - Mar 1, 2019$1K–$15K
$1K–$15K · Traded Feb 4, 2019 · disclosed Mar 1, 2019 · Joint
- Mar 1, 2019$1K–$15K
$1K–$15K · Traded Feb 4, 2019 · disclosed Mar 1, 2019 · Joint
- Mar 1, 2019$1K–$15K
$1K–$15K · Traded Feb 4, 2019 · disclosed Mar 1, 2019 · Joint
- Mar 1, 2019$1K–$15K
Sold (partial) IQVIA Holdings IQV
$1K–$15K · Traded Feb 4, 2019 · disclosed Mar 1, 2019 · Joint
- Mar 1, 2019$1K–$15K
$1K–$15K · Traded Feb 4, 2019 · disclosed Mar 1, 2019 · Joint
- Mar 1, 2019$1K–$15K
Sold (full) Honeywell International HON
$1K–$15K · Traded Feb 4, 2019 · disclosed Mar 1, 2019 · Joint
- Mar 1, 2019$1K–$15K
$1K–$15K · Traded Feb 4, 2019 · disclosed Mar 1, 2019 · Joint
- Mar 1, 2019$1K–$15K
$1K–$15K · Traded Feb 4, 2019 · disclosed Mar 1, 2019 · Joint
- Mar 1, 2019$1K–$15K
$1K–$15K · Traded Feb 4, 2019 · disclosed Mar 1, 2019 · Joint
- Mar 1, 2019$1K–$15K
Sold (full) Costco Wholesale COST
$1K–$15K · Traded Feb 4, 2019 · disclosed Mar 1, 2019 · Joint
- Mar 1, 2019$1K–$15K
Sold (full) Intuitive Surgical ISRG
$1K–$15K · Traded Feb 4, 2019 · disclosed Mar 1, 2019 · Joint
- Mar 1, 2019$1K–$15K
Sold (full) Illinois Tool Works ITW
$1K–$15K · Traded Feb 4, 2019 · disclosed Mar 1, 2019 · Joint
- Dec 12, 2018$1K–$15K
$1K–$15K · Traded Nov 28, 2018 · disclosed Dec 12, 2018
- Dec 12, 2018$1K–$15K
$1K–$15K · Traded Nov 28, 2018 · disclosed Dec 12, 2018
- Aug 1, 2018$1K–$15K
Sold (full) United Natural Foods UNFI
$1K–$15K · Traded Jul 27, 2018 · disclosed Aug 1, 2018
- Jul 18, 2018$1K–$15K
$1K–$15K · Traded Jul 5, 2018 · disclosed Jul 18, 2018 · Joint
- Mar 12, 2018$1K–$15K
Sold (partial) Intuitive Surgical ISRG
$1K–$15K · Traded Mar 9, 2018 · disclosed Mar 12, 2018 · Joint
- Mar 12, 2018$1K–$15K
Sold (partial) Vertex Pharmaceuticals VRTX
$1K–$15K · Traded Mar 9, 2018 · disclosed Mar 12, 2018 · Joint
- Mar 12, 2018$1K–$15K
Sold (partial) Thermo Fisher Scientific TMO
$1K–$15K · Traded Mar 9, 2018 · disclosed Mar 12, 2018 · Joint
- Mar 12, 2018$1K–$15K
Sold (partial) iShares U.S. Transportation ETF IYT
$1K–$15K · Traded Mar 9, 2018 · disclosed Mar 12, 2018 · Joint
- Mar 12, 2018$1K–$15K
$1K–$15K · Traded Mar 9, 2018 · disclosed Mar 12, 2018 · Joint
From periodic transaction reports Reed filed under the STOCK Act. Amounts are the ranges members report, and trades can be disclosed up to 45 days after they happen. Nothing here is investment advice.